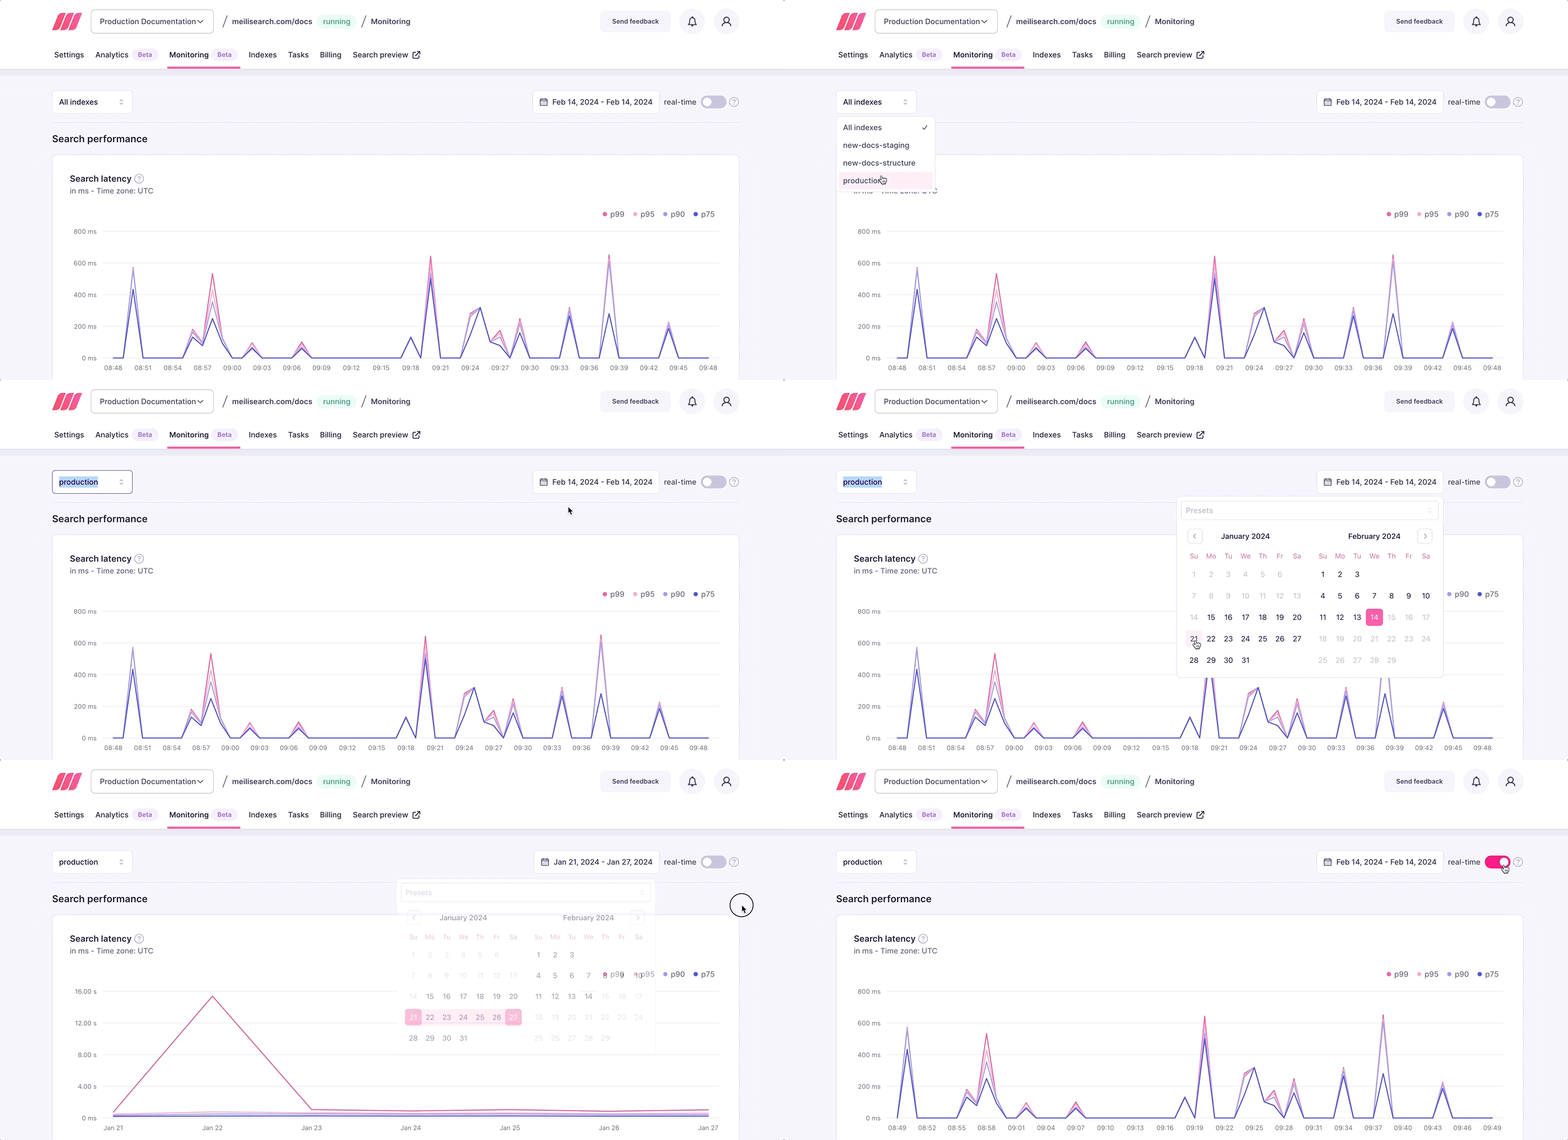
The new dashboard incorporates a set of metrics providing insights into your project’s performance. We want to help engineers move faster by making it easier to spot issues during implementation and having better visibility on your Meilisearch database health.
What metrics can you expect?
This first iteration comes with:
- 30 days of data retention
- Real-time mode
Search performance metrics
- Search latency
- Maximum search queries per second
Operations metrics
- Bandwidth (in/out)
- API Calls — Succeeded/Failed
The default view combines the data from the indexes per project, but it’s also possible to filter out the insights for a specific index of your choice. The dashboard also allows you to select a custom range using a date picker or get real-time data insights:

Why use monitoring?
With our brand-new dashboard, you can:
- Ensure your users are getting lightning-fast search responses for every query
- Monitor how your search functionality holds up under varying loads, not only during peak traffic conditions but also while indexing
- Identify and rectify any performance bottlenecks or errors
- Proactively maintain and optimize your project
Availability and plans
The new Cloud monitoring metrics are available for all Cloud users across all pricing tiers. Each tier has access to the same metrics and chart functionalities of the monitoring metrics dashboard.
Learn how to get started with Meilisearch Cloud and read the Monitoring documentation.
Stay in the loop by subscribing to our newsletter. To learn more about Meilisearch's future and help shape it, take a look at our roadmap and participate in our Product Discussions.
For anything else, join our developer community on Discord.

